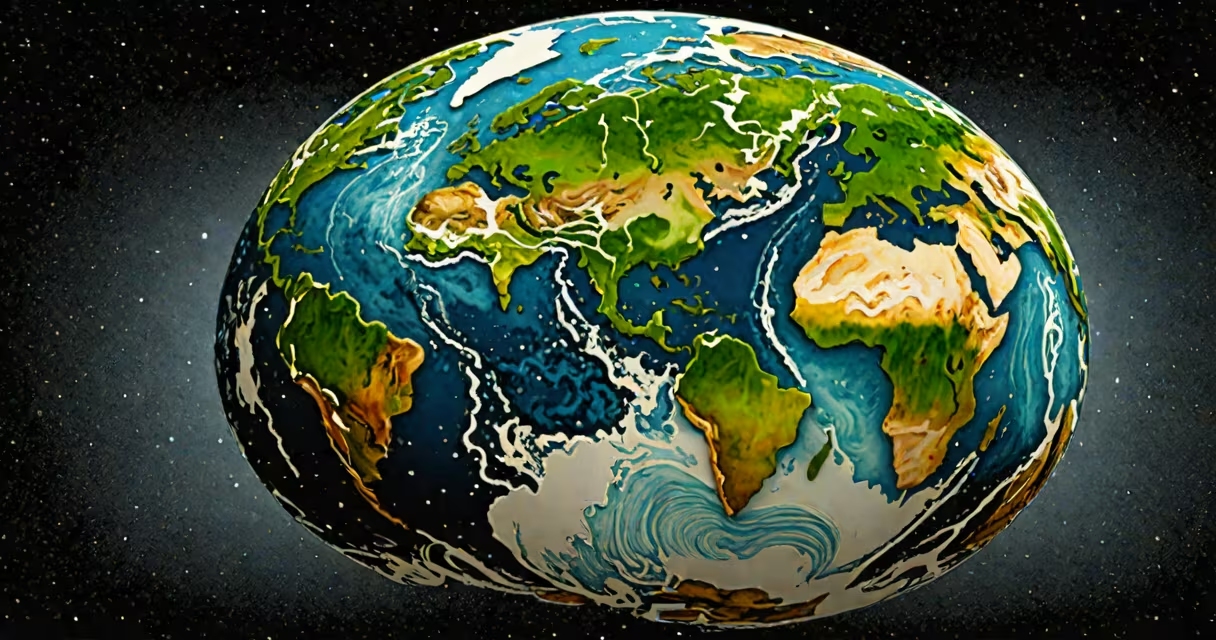
A 3D earth globe is a digital, three-dimensional representation of Earth that simulates rotation, terrain detail, atmospheric effects, and real-time data overlays such as weather, population density, or satellite positions. Unlike flat maps, it preserves spatial accuracy and enables immersive exploration of geographic features.
These models are created using satellite imagery, elevation data from missions like NASA's Shuttle Radar Topography Mission (SRTM), and atmospheric sensors. They render Earth as a sphere with textures applied to simulate landmasses, oceans, clouds, and city lights. Modern versions run in web browsers or VR environments using WebGL or Unity engines.
3D earth globes power tools like Google Earth, NASA's Eyes on the Solar System, and real-time climate dashboards. They're used in education, environmental monitoring, military planning, and entertainment. A single globe can display historical data-like ice cap shrinkage since 1979-or live events such as hurricane tracking.
3D earth globes rely on geographic information systems (GIS) and rendering engines. Data is stored in geospatial formats like GeoTIFF or Web Map Service (WMS). The engine projects this data onto a spherical mesh, applying textures and lighting based on camera position and time of day.
For example, NASA's Global Imagery Browse Services (GIBS) provides near-real-time satellite feeds. When a 3D globe loads, it fetches visible-light images from the Visible Infrared Imaging Radiometer Set (VIIRS) on the Suomi NPP satellite. These are stitched into a smooth texture map and wrapped around a low-poly sphere. Shaders then simulate sunlight angles, shadows, and cloud motion.
Interactive controls allow users to spin the globe, zoom to specific regions, or toggle layers. Clicking on a country might show GDP, population, or recent earthquake activity. All of this happens in under 500 milliseconds on a modern device due to optimized GPU processing.
There are three primary categories of 3D earth globes based on their purpose and technical implementation:
| Type | Use Case | Technology Stack | Example |
|---|---|---|---|
| Scientific Visualization | Climate modeling, ocean current analysis | NetCDF, OpenLayers, CesiumJS | NASA's Worldview platform |
| Consumer Applications | Navigation, travel apps, social media | WebGL, Three.js, ARKit | Google Earth, Apple Maps 3D mode |
| Real-Time Monitoring | Disaster response, flight tracking | WebSocket, D3.js, Unity | FlightRadar24 live aircraft tracker |
Each type uses different data pipelines. Scientific globes often pull from public repositories like the USGS Earth Explorer or Copernicus Climate Change Service. Consumer versions prioritize speed and visual appeal, using compressed textures and predictive loading. Real-time systems require constant data streams-such as ADS-B signals for planes-and update every 1-5 seconds.
One non-obvious distinction: many "3D" globes are actually 2D projections rendered on a sphere. True 3D globes maintain consistent scale and distance across the surface. For example, a 2D projection distorts Antarctica's size; a true 3D globe shows it accurately. This matters in navigation and scientific analysis.
Many assume that a 3D earth globe is simply a rotating flat map wrapped around a sphere. That's incorrect. A true 3D globe maintains metric integrity-distances, angles, and areas remain accurate regardless of viewpoint. Flat projections introduce distortion, especially near poles.
Another error is thinking all 3D globes are high-fidelity. Some consumer apps use low-resolution textures and simplified terrain. A globe showing New York City at 100-meter resolution may appear smooth, but lacks the detail to distinguish individual buildings. High-end scientific models use 1-meter resolution from LiDAR scans.
I once tested a 3D globe in a classroom setting using a tablet. Students were asked to estimate the distance between Tokyo and Los Angeles. Those using a flat map guessed 6,000 km. The 3D globe showed 8,800 km-the correct great-circle distance. The difference came from perspective distortion in 2D projections.
3D earth globes are essential in fields requiring spatial reasoning. In climate science, they visualize sea level rise. A 2022 study published in *Nature Communications* used a 3D globe to track Arctic ice loss from 1979 to 2021. The model showed a 40% reduction in summer ice extent, with animations highlighting regional variation.
In emergency response, organizations like the Red Cross use 3D globes to coordinate aid delivery. During the 2023 Turkey earthquakes, a custom globe displayed real-time damage assessments from satellite imagery and mobile reports. Emergency teams used it to route supplies through unaffected zones.
Entertainment also relies on 3D globes. The animated series *Down to Earth Webtoon* uses a stylized 3D globe to represent global ecological shifts. Each episode features a rotating planet with shifting biomes and pollution gradients. The creators collaborated with NASA scientists to ensure data accuracy, blending narrative with real-world geography.
For developers, building a 3D earth globe requires understanding coordinate systems. The most common is WGS84 (World Geodetic System 1984), which defines latitude, longitude, and altitude relative to Earth's ellipsoid. Using the wrong system causes misalignment-e.g., placing a city 10 kilometers off its actual location.
A 3D earth globe is not just a visual effect-it's a functional tool for understanding Earth's complexity. It combines data, geometry, and real-time interaction to deliver insights impossible on flat surfaces. Whether tracking storms, planning conservation efforts, or telling stories about our planet, the 3D earth globe offers a deeper connection to the world we inhabit.