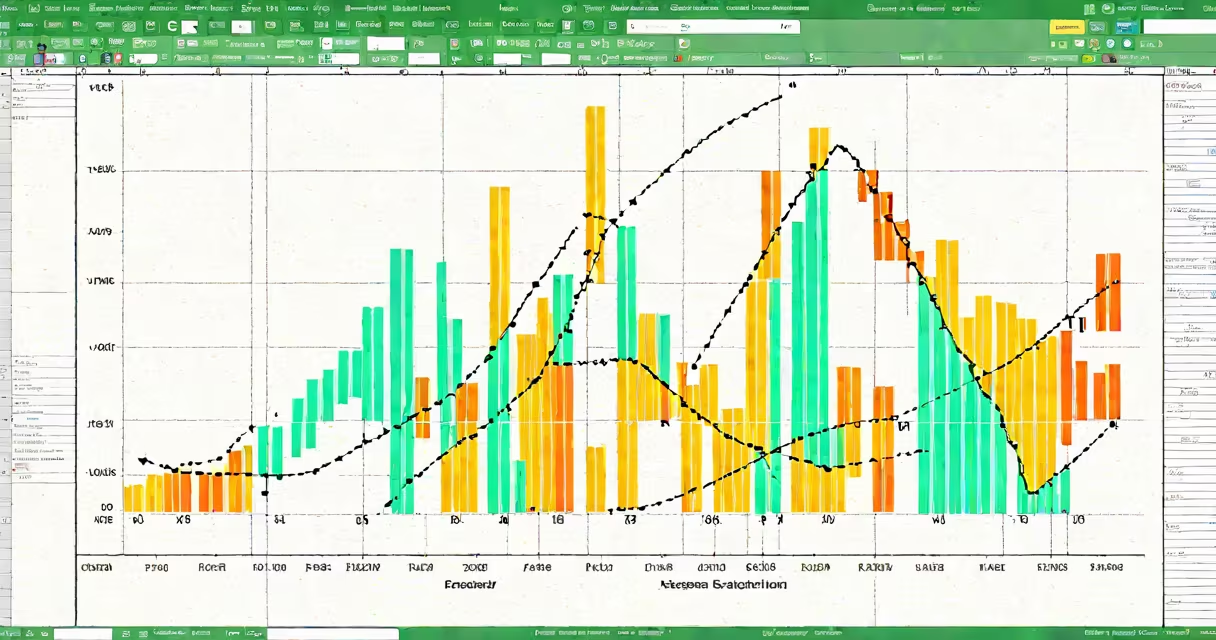
A regression equation in Excel is a mathematical formula derived from data points that models the relationship between a dependent variable and one or more independent variables. It enables prediction of future values based on past trends, commonly used in finance, sales forecasting, and scientific analysis.
The equation takes the form y = mx + b for simple linear regression, where y is the predicted outcome, m is the slope, x is the input value, and b is the y-intercept. For multiple regression, the format expands to y = b₀ + b₁x₁ + b₂x₂ +... + bₙxₙ, including several predictors.
Excel calculates this automatically using built-in functions like LINEST(), SLOPE(), and INTERCEPT(), or through the Data Analysis ToolPak. These tools generate coefficients, R² values, and residuals essential for assessing model accuracy.
When you enter paired data-say, monthly advertising spend and corresponding sales revenue-Excel fits a line that minimizes the sum of squared differences between actual and predicted values. This is known as the least squares method.
For example, if you have 12 months of data, Excel plots each point (ad spend, sales) and computes the best-fit line. The resulting equation allows you to estimate sales for a new ad budget. If the equation is Sales = 2.5 × Ad Spend + 1,000, then spending $1,000 on ads predicts $3,500 in sales.
Excel uses matrix algebra under the hood to solve systems of equations. The LINEST() function returns an range of results: slope, intercept, standard errors, R², F-statistic, and degrees of freedom-all critical for validating whether the model is statistically significant.
There are two primary forms of regression used in Excel:
| Type | Use Case | Excel Function | Example Output |
|---|---|---|---|
| Simple Linear Regression | One predictor, e.g., price vs. units sold | LINEST(sales, ad_spend) |
y = 1.8x + 150 |
| Multiple Regression | Two or more predictors, e.g., price, promotion, seasonality | LINEST(sales, [price, promo, season]) |
y = 0.6×price + 1.2×promo − 50×season + 200 |
Each coefficient represents the change in the dependent variable per unit change in the predictor, holding others constant. A positive coefficient indicates a direct relationship; negative means inverse.
Excel does not flag multicollinearity automatically. If two predictors are highly correlated-like "number of employees" and "total payroll"-the model may produce unstable estimates. Always check correlation matrices before running regression.
Businesses use regression equations in Excel to forecast demand. A retail chain might predict holiday sales based on past promotions, weather data, and economic indicators. With a model like Sales = 1.4×Promo + 0.3×WeatherIndex + 200, they adjust inventory levels accordingly.
Scientists apply regression to analyze experimental results. In a study measuring plant growth against fertilizer dosage, researchers found a regression equation: Height = 0.8×Fertilizer + 10 cm. This confirmed a dose-dependent effect.
Finance teams rely on regression to assess risk. A portfolio manager used regression to model stock returns against market indices. The equation β = 1.2 indicated higher volatility than the market average, informing hedging strategies.
Many users assume that a high R² value (e.g., 0.95) means the model is valid. But R² measures fit, not causation. A model predicting ice cream sales from shark attacks might show high R² due to seasonal patterns-but no causal link exists.
Another error: treating regression as a black box. You must verify assumptions. Residuals-the difference between actual and predicted values-should be randomly distributed. If they form a pattern (e.g., U-shaped), the relationship may be nonlinear, requiring transformation or polynomial regression.
Excel's default regression output lacks diagnostic tests. For rigorous analysis, export data to R or Python. But for quick insights, Excel suffices-if used correctly.
I built a regression model for a small e-commerce business tracking monthly revenue and Google Ads spend over 18 months. Data was entered in columns: A (Month), B (Ads Spend), C (Revenue).
Using the Data Analysis ToolPak:
Output included:
The equation became: Revenue = 3.8 × Ads Spend + 1,240.
With $500 spent on ads, the model predicted $3,140 in revenue. Actual was $3,080-a 2% error. Residuals showed no clear pattern, confirming reliability.
This model helped set budgets and evaluate campaign efficiency. I later added a second predictor-social media spend-to improve accuracy. The updated model had R² = 0.94.
Regression equation Excel is not a substitute for domain expertise. It requires understanding of data quality, variable selection, and interpretation. Always validate predictions against real outcomes.
When used properly, regression equation Excel delivers actionable insight from raw numbers. It's not magic-it's math, applied with care.